|
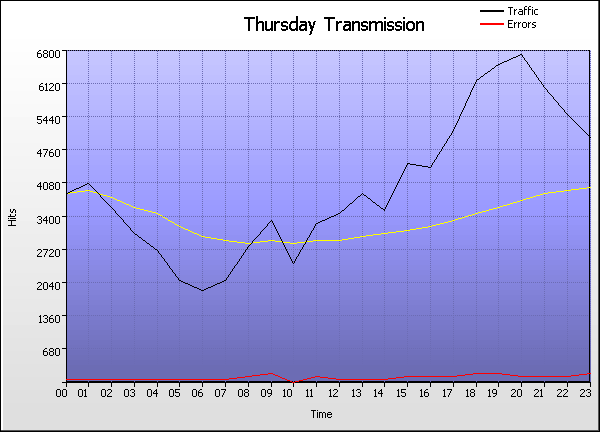
Thursday Transmission |
| |
Time |
Hits |
% |
Bytes |
% |
Sessions |
Visitors |
Pages |
Errors |
|
1 |
00:00 - 00:59 |
|
|
507 |
476 |
2,221 |
130 |
|
2 |
01:00 - 01:59 |
|
|
533 |
504 |
2,323 |
118 |
|
3 |
02:00 - 02:59 |
|
|
496 |
471 |
2,068 |
107 |
|
4 |
03:00 - 03:59 |
|
|
470 |
446 |
1,750 |
105 |
|
5 |
04:00 - 04:59 |
|
|
398 |
375 |
1,547 |
129 |
|
6 |
05:00 - 05:59 |
|
|
325 |
311 |
1,281 |
114 |
|
7 |
06:00 - 06:59 |
|
|
322 |
301 |
1,149 |
102 |
|
8 |
07:00 - 07:59 |
|
|
313 |
298 |
1,244 |
98 |
|
9 |
08:00 - 08:59 |
|
|
409 |
384 |
1,642 |
142 |
|
10 |
09:00 - 09:59 |
|
|
409 |
389 |
1,986 |
245 |
|
11 |
10:00 - 10:59 |
|
|
364 |
346 |
1,452 |
55 |
|
12 |
11:00 - 11:59 |
|
|
439 |
418 |
1,876 |
138 |
|
13 |
12:00 - 12:59 |
|
|
472 |
454 |
1,926 |
126 |
|
14 |
13:00 - 13:59 |
|
|
479 |
453 |
2,243 |
93 |
|
15 |
14:00 - 14:59 |
|
|
494 |
472 |
2,017 |
113 |
|
16 |
15:00 - 15:59 |
|
|
592 |
557 |
2,530 |
139 |
|
17 |
16:00 - 16:59 |
|
|
573 |
540 |
2,464 |
157 |
|
18 |
17:00 - 17:59 |
|
|
646 |
616 |
2,870 |
185 |
|
19 |
18:00 - 18:59 |
|
|
767 |
732 |
3,472 |
214 |
|
20 |
19:00 - 19:59 |
|
|
753 |
717 |
3,647 |
238 |
|
21 |
20:00 - 20:59 |
|
|
812 |
772 |
3,791 |
163 |
|
22 |
21:00 - 21:59 |
|
|
732 |
683 |
3,428 |
148 |
|
23 |
22:00 - 22:59 |
|
|
703 |
659 |
3,131 |
173 |
|
24 |
23:00 - 23:59 |
|
|
600 |
554 |
2,781 |
227 |
| |
Average |
|
|
525 |
497 |
2,284 |
144 |
|
24 |
Totals |
|
|
89,525 |
43,850 |
54,839 |
3,459 |
|
|