|
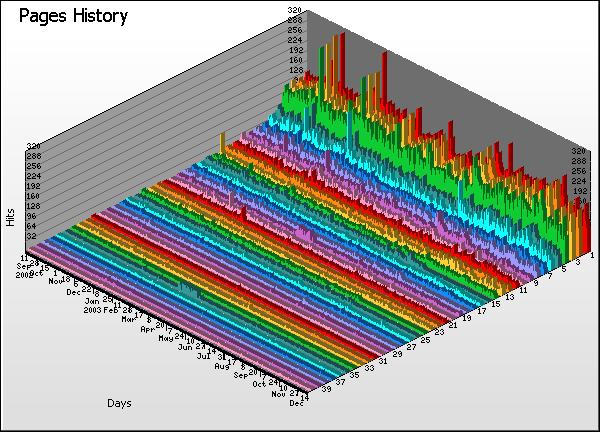
Pages History |
| |
Pages |
Hits |
% |
Bytes |
% |
Sessions |
Mean Time |
Visitors |
Errors |
|
1 |
/index.htm |
|
|
45,172 |
00:35 |
28,006 |
8 |
|
2 |
/html/common/main.htm |
|
|
42,037 |
00:52 |
27,174 |
6 |
|
3 |
/html/common/menu.htm |
|
|
41,893 |
00:36 |
26,995 |
33 |
|
4 |
/html/common/copyw.htm |
|
|
41,777 |
00:38 |
26,907 |
4 |
|
5 |
/html/common/winvroc.htm |
|
|
18,510 |
01:32 |
13,320 |
2 |
|
6 |
/html/common/winvroc-fix.htm |
|
|
15,094 |
01:42 |
10,940 |
3 |
|
7 |
/html/common/download.htm |
|
|
11,171 |
00:55 |
8,771 |
0 |
|
8 |
/html/common/start.htm |
|
|
10,615 |
01:10 |
8,111 |
2 |
|
9 |
/html/common/vrocip.htm |
|
|
8,373 |
01:27 |
6,578 |
2 |
|
10 |
/html/common/help.htm |
|
|
5,901 |
00:57 |
4,281 |
0 |
|
11 |
/html/common/winvroc-help.htm |
|
|
5,875 |
01:23 |
4,471 |
0 |
|
12 |
/html/common/stuff.htm |
|
|
5,296 |
01:03 |
4,362 |
0 |
|
13 |
/robots.txt |
|
|
5,235 |
00:30 |
643 |
5,485 |
|
14 |
/html/vroc20/servers.htm |
|
|
4,750 |
01:17 |
3,742 |
0 |
|
15 |
/html/vroc20/roomgpl.htm |
|
|
3,443 |
01:41 |
2,790 |
0 |
|
16 |
/html/common/overview.htm |
|
|
3,306 |
01:04 |
2,756 |
0 |
|
17 |
/html/common/tech.htm |
|
|
3,106 |
01:43 |
2,531 |
0 |
|
18 |
/html/vroc20/options.htm |
|
|
2,591 |
01:28 |
2,091 |
0 |
|
19 |
/html/common/club.htm |
|
|
2,870 |
01:23 |
1,875 |
0 |
|
20 |
/vroc/ |
|
|
2,079 |
00:53 |
1,769 |
2,905 |
|
21 |
/html/common/chats.htm |
|
|
2,638 |
01:01 |
2,165 |
0 |
|
22 |
/html/common/gpl-patches.htm |
|
|
2,596 |
01:08 |
2,210 |
0 |
|
23 |
/html/common/winvrocnotes.htm |
|
|
2,523 |
01:26 |
2,139 |
0 |
|
24 |
/html/vroc20/roomgplWide.htm |
|
|
2,408 |
01:15 |
2,066 |
0 |
|
25 |
/html/common/weather.htm |
|
|
2,440 |
00:46 |
2,121 |
0 |
|
26 |
/html/common/leagues.htm |
|
|
1,940 |
01:04 |
1,602 |
0 |
|
27 |
/html/common/winvroc-options.htm |
|
|
2,014 |
01:16 |
1,699 |
0 |
|
28 |
/html/common/news-archive2000.htm |
|
|
1,762 |
00:52 |
1,538 |
0 |
|
29 |
/html/common/lists.htm |
|
|
1,698 |
00:52 |
1,435 |
0 |
|
30 |
/html/common/gpl11faq.htm |
|
|
1,621 |
00:42 |
1,321 |
0 |
|
31 |
/html/common/core-notes.htm |
|
|
1,657 |
01:14 |
1,433 |
0 |
|
32 |
/html/common/gpl12faq.htm |
|
|
1,495 |
01:11 |
1,296 |
0 |
|
33 |
/html/common/start-jv.htm |
|
|
1,278 |
01:08 |
1,074 |
0 |
|
34 |
/html/common/tech2.htm |
|
|
1,463 |
01:30 |
1,274 |
0 |
|
35 |
/html/common/support.htm |
|
|
1,363 |
00:37 |
696 |
0 |
|
36 |
/html/common/help-jv.htm |
|
|
1,327 |
01:06 |
1,116 |
0 |
|
37 |
/html/common/trouble.htm |
|
|
1,310 |
01:07 |
1,096 |
0 |
|
38 |
/html/common/driving.htm |
|
|
1,345 |
00:57 |
1,158 |
0 |
|
39 |
/html/common/winvroc-hosting.htm |
|
|
1,227 |
01:03 |
999 |
0 |
|
40 |
/html/common/time.htm |
|
|
1,270 |
00:41 |
1,083 |
0 |
| |
Subtotals |
|
|
314,469 |
4922:17:10 |
217,634 |
8,450 |
|
361 |
Others |
|
|
22,950 |
332:12:23 |
17,971 |
4,877 |
| |
Average |
|
|
841 |
00:56 |
587 |
33 |
|
401 |
Totals |
|
|
337,419 |
5254:29:33 |
235,605 |
13,327 |
|
|


