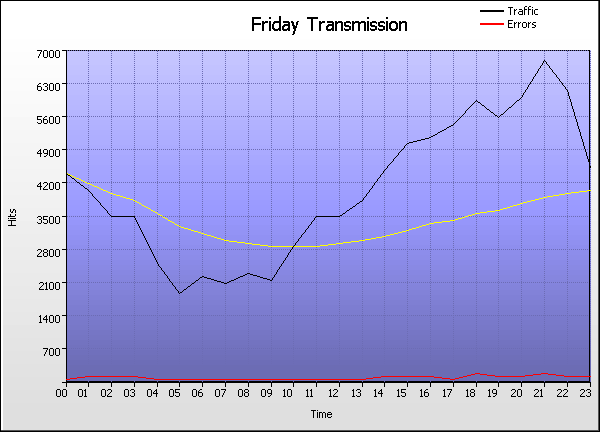
Time Graph
Go the Help Card.


Friday Transmission
  Time Hits % Bytes % Sessions Visitors Pages Errors
1 00:00 - 00:59
4,456    4.52%
0    0%
584 534 2,481 139
2 01:00 - 01:59
4,083    4.14%
0    0%
537 507 2,390 151
3 02:00 - 02:59
3,509    3.56%
0    0%
535 500 1,941 151
4 03:00 - 03:59
3,554    3.61%
0    0%
427 404 1,999 153
5 04:00 - 04:59
2,528    2.57%
0    0%
400 382 1,439 90
6 05:00 - 05:59
1,902    1.93%
0    0%
359 340 1,092 84
7 06:00 - 06:59
2,298    2.33%
0    0%
344 321 1,318 102
8 07:00 - 07:59
2,136    2.17%
0    0%
332 313 1,239 112
9 08:00 - 08:59
2,320    2.35%
0    0%
337 317 1,408 133
10 09:00 - 09:59
2,204    2.24%
0    0%
376 359 1,267 75
11 10:00 - 10:59
2,920    2.96%
0    0%
394 379 1,722 106
12 11:00 - 11:59
3,533    3.59%
0    0%
472 443 2,049 112
13 12:00 - 12:59
3,552    3.60%
0    0%
483 455 2,007 107
14 13:00 - 13:59
3,893    3.95%
0    0%
534 506 2,117 123
15 14:00 - 14:59
4,530    4.60%
0    0%
588 557 2,470 156
16 15:00 - 15:59
5,108    5.18%
0    0%
683 646 2,871 181
17 16:00 - 16:59
5,194    5.27%
0    0%
596 558 2,999 157
18 17:00 - 17:59
5,496    5.58%
0    0%
680 644 3,062 126
19 18:00 - 18:59
6,005    6.09%
0    0%
740 699 3,351 234
20 19:00 - 19:59
5,665    5.75%
0    0%
697 657 3,223 158
21 20:00 - 20:59
6,024    6.11%
0    0%
796 752 3,381 167
22 21:00 - 21:59
6,826    6.93%
0    0%
827 769 3,821 212
23 22:00 - 22:59
6,225    6.32%
0    0%
709 664 3,497 173
24 23:00 - 23:59
4,571    4.64%
0    0%
581 555 2,568 167
  Average
4,105    4.17%
0    0%
542 510 2,321 140
24 Totals
98,532    100%
0    0%
89,525 43,850 55,712 3,369
Go the Help Card.

Help Card: Friday Transmission
Report Overview This report details the hour-by-hour breakdown of traffic generated on all Fridays. Use this information to assess the damage of unforeseen downtime, or to find key traffic spikes that could be used to influence special features or promotions.

This report may be affected by world time zones. Many webservers generate timestamps in Greenwich Mean Time (GMT+0), which may not be your local time zone. The time data in your logs can be adjusted to represent your local time zone, in Settings > Analysis > Options > Date range > Time adjust.

Graph Description Vertical axis: Hits (default sorting).
Number of hits to the site. Changing the sorting options in Settings > Statistics will alter the vertical axis to the new sort method (Visitors, Bytes, etc). This report may be sorted by hits, bytes, sessions, visitors, pages or errors.

Horizontal axis: Time
The hour of the day.

Red line (if present):
HTTP errors (Page not found, server error, etc)

Table Description Time:
The hourly period of the corresponding day.

Hits (%):
Number of hits to the site during the corresponding hourly period. (Percentage as a proportion of hits to the site during the day's 24 hours.)

Bytes (%):
Number of bytes transferred as a result of hits to the site during the corresponding hourly period. For readability, these values may be suffixed with kilobytes (KB), megabytes (MB) or gigabytes (GB), where applicable. (Percentage as a proportion of bytes transferred during the day's 24 hours.)

Sessions:
Total number of sessions undertaken during the corresponding hourly period. This number includes sessions undertaken by 'repeat' visitors.

Visitors:
Total number of unique visitors who undertook one or more sessions during the corresponding hourly period. Note that this figure represents a unique hourly visitor count, not a unique daily visitor count (as a unique visitor for one hour may return in another hour). As such, the "Totals" value will be cumulative for the 24 hours and the overall totals for individual days may appear higher than expected.

Pages
Number of pages viewed during the corresponding hourly period.

Errors
Number of server errors generated as a result of hits to the site during the corresponding hourly period.

Go back to the top.

Copyright © Quest Software , 1997-2002